Sine graph equation:
The general form of a sine function is like this:
Y = sin x.
As we already know, sine is a periodic function. The period of a sine function is 2 pi. That means each value repeats itself after an interval of 2𝛑 on the x axis. The range of the sin function is from -1 to 1. So the value of sin x would not exceed 1 and would not go below -1 at any point. To be able to plot the graph of the function, let us make a table of values of the sine function.
The graph of the above table would look like a wave.
Cosine graph equation:
Just like the sine function, the cosine function is also periodic. The parent cosine function would be like this:
y = cos x
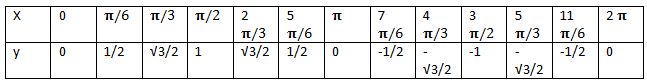
Similar to the sine function, the range of the cosine function is also from -1 to 1. The period of the cosine function is also 2𝛑. That means that the value of the function repeats itself after an interval of 2𝛑. To be able to plot the cosine function now let us make a table of values of cos.

The graph of the function would look like this:

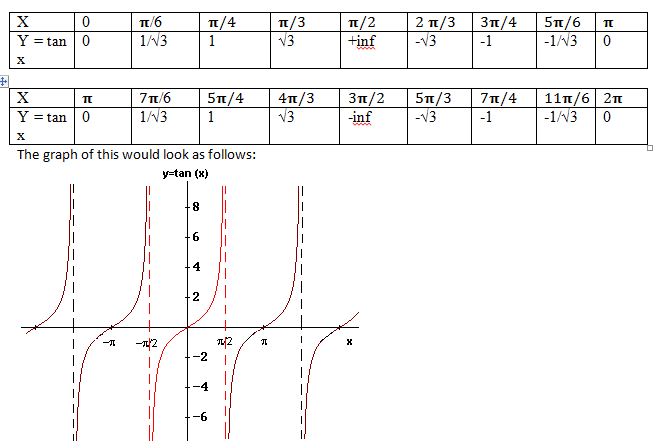
How to graph tangent functions?
The tangent function is also a periodic function. However the period of the tangent function is 𝛑. That means the values repeat itself after an interval of ?? on the x axis. The range of the tangent function is –inf to inf. That means that the tangent function can have any real number value. Just like how we did for the sine and the cosine functions, for plotting the tangent function also we shall make a table of values.