Double Bar Graphs, also called as Double Bar Chart, is the type of bar graph that helps in finding the relationship between two set of data. These are used to compare the data between same value and within the group of value from time to time. Double Bar Graphs also has all the advantage and attributes as it like the regular bar graph. Double Bar Graphs may be created in horizontal or vertical position as per the given data.
Double Bar Graphs Properties
Advantage and Difference between Single Bar Graph and Double Bar Graphs
Illustration for Double Bar Graphs
Let us see in detail about the double bar graph with an example. Construct a double bar graph for the given set of data.
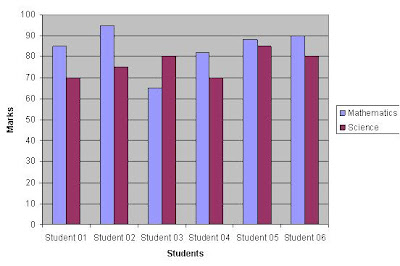 Mathematics Science
Student 01 85 70
Student 02 95 75
Student 03 65 80
Student 04 82 70
Student 05 88 85
Student 06 90 80
Double Bar Graphs Properties
- We have to follow the instruction to construct the double bar graphs. The instructions are given below.
- The frequency scale must start from zero and go up in equal steps in x-axis and y-axis.
- Bars should have equal width.
- Two types of data should have different colors and the abbreviation for the color was given separately in the graph sheet.
- Both of the axes were labeled and they should name as per the given data.
Advantage and Difference between Single Bar Graph and Double Bar Graphs
- Double Bar Graphs are easy to construct with the help of given set of data.
- It is easy to understand and easy to find the difference between two set of data.
- Data group in the double bar graph is represented by two bars as comparing with single bar graph
Illustration for Double Bar Graphs
Let us see in detail about the double bar graph with an example. Construct a double bar graph for the given set of data.
 Mathematics Science
Student 01 85 70
Student 02 95 75
Student 03 65 80
Student 04 82 70
Student 05 88 85
Student 06 90 80
- Double bar graph was drawn for six students to compare their marks in mathematics and science.
- To construct the graph, first we have to decide about the title of the graph.
- Then choose the vertical or horizontal bars.
- We name the x-axis as students and y-axis as marks.
- Choose the scale in the y-axis as per the given marks.
- Put label on the graph and finally draw the bars.
No comments:
Post a Comment